
Introduction
Marketing is no longer about simply publishing advertisements, posting on social media, or creating blog content and hoping that customers will respond. Modern marketing is increasingly data-driven.
Businesses need to know what is working, what is not working, where customers are coming from, how much marketing activities cost, and whether those activities are contributing to business growth.
This is where Marketing KPIs become important.
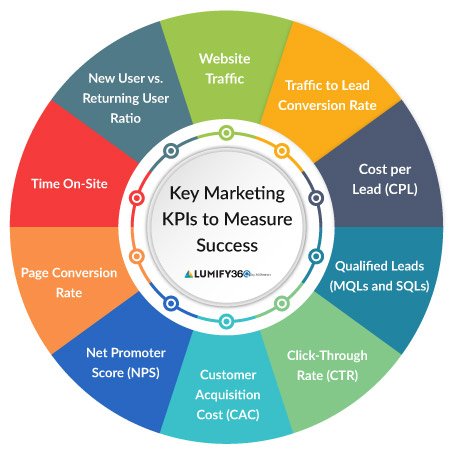
Marketing KPIs help businesses measure performance using specific, trackable indicators. They can help marketers understand website traffic, engagement, leads, conversions, customer acquisition costs, revenue, advertising performance, email campaigns, SEO, social media, and many other areas.
However, there is one important point to understand:
Not every marketing metric is a KPI.
A metric becomes a useful KPI when it is connected to an important business or marketing objective.
For example, website traffic can be useful, but traffic alone does not necessarily mean that a business is growing. If a website receives thousands of visitors but generates very few qualified leads or sales, the business may need to investigate why.
Similarly, a social media post may receive thousands of likes, but if the business objective is generating qualified leads, likes alone may not tell the complete story.
The purpose of this guide is to explain Marketing KPIs in simple language and show how marketers can use them to make better data-informed decisions.
What Are Marketing KPIs?
KPI stands for Key Performance Indicator.
A Marketing KPI is a measurable value used to evaluate whether a marketing activity or strategy is achieving a specific objective.
In simple words:
Marketing KPIs help you measure whether your marketing efforts are moving toward your goals.
For example, suppose a company wants to generate 500 qualified leads in three months.
The company could track:
- Number of leads
- Qualified leads
- Cost per lead
- Lead conversion rate
- Landing page conversion rate
- Customer acquisition cost
- Lead-to-customer rate
These measurements help marketers understand how effectively their marketing strategy is performing.
Why Are Marketing KPIs Important?
Marketing without measurement can become difficult to manage.
KPIs provide a framework for understanding performance.
1. KPIs Help Measure Progress
Suppose your goal is to increase website leads by 30%.
Without a KPI, you may not know whether you are getting closer to that goal.
Lead volume and conversion rate can provide measurable indicators of progress.
2. KPIs Help Identify Problems
Imagine your website traffic has increased significantly, but sales have not increased.
That could indicate problems with:
- Website conversion
- Product positioning
- Pricing
- Landing pages
- Audience targeting
- Lead quality
- Sales follow-up
KPIs can help identify where further investigation is needed.
3. KPIs Help Allocate Marketing Budgets
Businesses often have limited marketing budgets.
Performance data can help marketers understand which campaigns, channels, and activities are producing useful results.
For example, a company may compare:
- SEO
- Google Ads
- Meta Ads
- Email marketing
- Content marketing
- Social media
The goal is not simply to find the channel with the cheapest click. The goal is to understand which activities contribute to meaningful business outcomes.
4. KPIs Support Better Decision-Making
Marketing teams can use KPI data to test assumptions and make decisions based on evidence.
Instead of saying:
“This campaign feels successful.”
You can ask:
“Did this campaign generate qualified leads at an acceptable cost?”
That is a much more useful business question.
KPI vs Metric: What Is the Difference?
The terms metric and KPI are sometimes used interchangeably, but they are not exactly the same.
A metric is a measurable data point.
A KPI is a metric that has been selected because it is particularly important for evaluating progress toward a specific objective.
For example:
Metrics:
- Website sessions
- Page views
- Likes
- Impressions
- Clicks
Possible KPIs:
- Qualified leads
- Revenue generated
- Customer acquisition cost
- Conversion rate
- Return on advertising spend
The same metric can be important in one situation and less important in another.
How to Choose the Right Marketing KPIs
Choosing KPIs should begin with your goals.
A simple framework is:
Business Goal → Marketing Objective → KPI → Target → Measurement → Optimization
For example:
Business Goal: Increase revenue
Marketing Objective: Generate more qualified customers
KPIs:
- Qualified leads
- Lead-to-customer rate
- Customer acquisition cost
- Revenue
- Marketing ROI
This approach keeps measurement connected to business outcomes.
SMART Marketing Goals
Marketing KPIs work better when goals are clearly defined.
One common framework is SMART:
- Specific
- Measurable
- Achievable
- Relevant
- Time-bound
Instead of:
“Increase website traffic.”
A clearer goal might be:
“Increase organic website sessions by 25% over the next six months.”
Now you have a specific objective and a measurable timeframe.
The Most Important Marketing KPI Categories
Marketing KPIs can be divided into several categories:
- Awareness KPIs
- Website KPIs
- SEO KPIs
- Content marketing KPIs
- Social media KPIs
- Paid advertising KPIs
- Lead generation KPIs
- Conversion KPIs
- Email marketing KPIs
- E-commerce KPIs
- Customer KPIs
- Revenue KPIs
- ROI and profitability KPIs
Let’s examine each category.
Part 1: Brand Awareness KPIs
Brand awareness KPIs measure how effectively marketing activities are helping people discover and recognize a business.
1. Impressions
An impression represents an instance in which content or an advertisement is displayed.
For example, if an advertisement is displayed 10,000 times, it can generate 10,000 impressions.
Impressions help measure exposure.
However, impressions alone do not tell you whether people engaged with the advertisement or became customers.
2. Reach
Reach represents the number of unique people who were exposed to content or advertising within a particular measurement context.
Reach is different from impressions.
For example:
Reach: 5,000 people
Impressions: 12,000
This could mean that the content was shown multiple times to some users.
3. Brand Search Volume
Brand search volume measures how often people search for your brand name or branded terms.
An increase in branded searches can sometimes indicate increased awareness, although it should be interpreted alongside other data.
For example, a business may track searches for:
- Company name
- Product name
- Brand + service
- Brand + location
4. Share of Voice
Share of voice attempts to measure how visible your brand is compared with competitors within a defined market, channel, or advertising environment.
It can be useful for competitive analysis.
Part 2: Website Marketing KPIs
Your website is often an important part of your marketing system.
5. Website Traffic
Website traffic measures visits or sessions to your website, depending on the analytics system being used.
Traffic can come from:
- Organic search
- Paid search
- Social media
- Direct visits
- Referral websites
- Other sources
Traffic is useful, but quality matters.
6. Organic Traffic
Organic traffic refers to visitors who arrive through unpaid search engine results.
SEO teams commonly monitor organic traffic to understand search visibility and content performance.
7. Paid Traffic
Paid traffic comes from advertising campaigns.
Examples include:
- Google Ads
- Meta Ads
- Display advertising
- Video advertising
8. Referral Traffic
Referral traffic comes from links on other websites.
For example, if another website links to your article and someone clicks that link to visit your site, the visit may be categorized as referral traffic.
9. Engagement Metrics
Modern analytics systems use different engagement measurements.
Depending on the platform, these can include:
- Engaged sessions
- Engagement rate
- Time-based engagement
- Pages or screens viewed
- Events
The exact definitions depend on the analytics platform.
10. Landing Page Conversion Rate
A landing page conversion rate measures how effectively a landing page encourages visitors to complete a desired action.
A simplified formula is:
Conversion Rate = Conversions ÷ Visitors × 100
For example:
1,000 visitors
50 conversions
Conversion rate:
5%
Part 3: SEO KPIs
Search engine optimization requires its own set of KPIs.
11. Organic Search Traffic
This measures visitors arriving through unpaid search results.
Tracking organic traffic can help you understand whether your SEO efforts are generating website visits.
12. Keyword Rankings
Keyword rankings show where your pages appear for specific search queries.
For example, a page might rank:
- Position 3
- Position 8
- Position 15
- Position 40
Rankings can change over time and should be analyzed across relevant keywords rather than relying on a single ranking.
13. Search Impressions
Search impressions indicate how often your website appears in search results within a particular reporting system.
Search impressions can help show changes in search visibility.
14. Organic CTR
Organic Click-Through Rate measures the percentage of search impressions that result in clicks.
A simplified formula is:
Organic CTR = Organic Clicks ÷ Search Impressions × 100
For example:
10,000 impressions
500 clicks
CTR:
5%
15. Backlinks
Backlinks are links from external websites pointing to your website.
Backlinks can be useful for SEO analysis, but quantity alone does not determine quality.
Marketers should consider:
- Relevance
- Authority
- Context
- Link quality
Part 4: Content Marketing KPIs
Content marketing requires more than counting how many articles have been published.
16. Content Views
Content views measure how many times a piece of content has been viewed.
This can include:
- Blog views
- Video views
- Guide downloads
- Podcast plays
17. Average Engagement
Engagement measurements can help show whether users are actually interacting with content.
Depending on the platform, this could include:
- Reading behavior
- Video watch time
- Scroll activity
- Comments
- Shares
- Clicks
18. Content Conversion Rate
This measures how often content visitors complete a desired action.
For example:
A blog receives 5,000 visits and generates 100 leads.
The lead conversion rate is:
2%
19. Content-Assisted Conversions
Sometimes content does not directly generate the final conversion but contributes to the customer’s journey.
For example:
A customer may:
- Read a blog post.
- Watch a product video.
- Visit a pricing page.
- Return through an advertisement.
- Purchase.
The blog may have played an assisting role even if it was not the final interaction.
Attribution should therefore be interpreted carefully.
Part 5: Social Media KPIs
Social media generates many measurable signals.
20. Followers
Follower count shows the size of your social audience.
However, follower count alone does not necessarily indicate business success.
21. Engagement Rate
Engagement rate measures interactions relative to an audience or reach, depending on the formula used.
Interactions may include:
- Likes
- Comments
- Shares
- Saves
- Clicks
Always document the formula because different platforms and tools calculate engagement differently.
22. Social Media Reach
This measures the number of unique users reached by your content.
23. Social Media Impressions
This measures how often your content was displayed.
24. Social Click-Through Rate
CTR can show how effectively social content encourages people to click a link.
A simplified formula is:
CTR = Clicks ÷ Impressions × 100
25. Social Conversions
Social conversions measure valuable actions resulting from social media activity.
Examples:
- Leads
- Purchases
- Registrations
- Downloads
- Bookings
Part 6: Paid Advertising KPIs
Paid advertising requires close measurement because money is being spent directly.
26. Cost Per Click
CPC measures the average cost associated with clicks.
Formula:
CPC = Advertising Cost ÷ Clicks
27. Click-Through Rate
CTR measures the percentage of impressions that result in clicks.
Formula:
CTR = Clicks ÷ Impressions × 100
28. Cost Per Mille
CPM represents the cost per 1,000 impressions.
Formula:
CPM = Advertising Cost ÷ Impressions × 1,000
CPM is commonly used when evaluating campaigns focused on reach or awareness.
29. Cost Per Lead
CPL measures the average advertising cost associated with generating a lead.
Formula:
CPL = Advertising Cost ÷ Leads
For example:
Advertising spend = $1,000
Leads = 100
CPL = $10
30. Cost Per Acquisition
CPA generally measures the cost associated with acquiring a desired conversion or customer, depending on the defined conversion.
A business should clearly define what “acquisition” means in its reporting.
31. Return on Ad Spend
ROAS measures revenue generated relative to advertising spend.
Formula:
ROAS = Revenue Attributed to Ads ÷ Advertising Cost
For example:
Advertising spend = $2,000
Attributed revenue = $8,000
ROAS = 4
This means $4 in attributed revenue for every $1 of advertising spend, before considering other business costs.
Part 7: Lead Generation KPIs
Lead generation is particularly important for service businesses.
32. Number of Leads
This is the total number of leads generated during a period.
33. Qualified Leads
Not every lead is equally valuable.
Qualified leads meet specific criteria defined by the business.
Tracking qualified leads can provide a better view of lead quality than simply counting all form submissions.
34. Lead Conversion Rate
This measures the percentage of relevant visitors or prospects who become leads.
For example:
5,000 visitors
200 leads
Lead conversion rate:
4%
35. Lead-to-Customer Rate
This measures how many leads eventually become customers.
Formula:
Lead-to-Customer Rate = Customers ÷ Leads × 100
For example:
200 leads
20 customers
Rate:
10%
Part 8: Email Marketing KPIs
Email marketing also has several important KPIs.
36. Open Rate
Email open rate measures the percentage of delivered emails reported as opened, where the measurement method supports it.
Because modern email privacy features can affect open tracking, marketers should avoid treating open rate as a perfect measure of attention.
37. Click-Through Rate
Email CTR measures the percentage of recipients who clicked one or more links, depending on the reporting definition.
38. Conversion Rate
Email conversion rate measures how many recipients completed a desired action.
Examples:
- Purchase
- Registration
- Download
- Booking
39. Unsubscribe Rate
This measures the percentage of recipients who unsubscribe from your email list.
A sudden increase can indicate problems with:
- Content relevance
- Frequency
- Audience targeting
- Expectations
- List quality
40. Email List Growth Rate
This measures how quickly your email subscriber base is growing.
A simplified formula can consider new subscribers minus unsubscribes and other losses relative to list size.
Part 9: Conversion KPIs
Conversion metrics help businesses understand whether marketing traffic is producing desired actions.
41. Conversion Rate
Conversion rate is one of the most widely used marketing KPIs.
Formula:
Conversion Rate = Conversions ÷ Relevant Visitors or Interactions × 100
The denominator should be clearly defined.
42. Number of Conversions
This is the total number of completed desired actions.
Conversions can include:
- Sales
- Leads
- Registrations
- Downloads
- Calls
- Bookings
43. Abandonment Rate
Abandonment rate can be useful for processes such as:
- Shopping carts
- Checkout
- Forms
- Applications
For example, an e-commerce business may analyze how many users add products to a cart but leave without purchasing.
Part 10: Customer KPIs
Marketing does not stop after a customer makes a purchase.
Customer-related KPIs can help measure long-term value.
44. Customer Acquisition Cost
CAC measures the average cost associated with acquiring a customer.
A simplified formula is:
CAC = Sales and Marketing Costs ÷ New Customers Acquired
The exact costs included should be defined consistently.
45. Customer Lifetime Value
CLV estimates the value a customer generates over the relationship with a business.
CLV calculations can vary significantly depending on the business model.
For a subscription company, CLV may involve:
- Average revenue
- Retention
- Churn
- Gross margin
For an e-commerce business, it may consider:
- Average order value
- Purchase frequency
- Customer lifespan
- Margin
46. Customer Retention Rate
Customer retention rate measures the percentage of customers a business retains during a defined period.
Retention is particularly important for subscription and recurring-revenue businesses.
47. Churn Rate
Churn rate measures the rate at which customers or subscribers stop using a product or service during a defined period.
High churn can affect long-term revenue and customer lifetime value.
Part 11: Revenue and Profitability KPIs
Ultimately, many marketing activities are expected to contribute to financial outcomes.
48. Marketing-Generated Revenue
This measures revenue attributed to marketing activities according to the company’s attribution model.
49. Marketing ROI
Marketing ROI attempts to measure the financial return generated by marketing relative to marketing investment.
A simplified formula is:
Marketing ROI = (Return – Marketing Investment) ÷ Marketing Investment × 100
However, calculating marketing ROI can be complicated because attribution, time delays, brand effects, and other factors can influence results.
50. Revenue Per Customer
This measures the average revenue associated with each customer over a defined period or customer relationship.
Vanity Metrics vs Meaningful KPIs
One of the biggest challenges in digital marketing is confusing impressive-looking numbers with meaningful business indicators.
A vanity metric can look good without necessarily showing business impact.
For example:
10,000 social media followers
may look impressive.
But if the business receives:
- Few qualified leads
- Few sales
- Low customer retention
then follower count alone does not demonstrate marketing effectiveness.
A better approach is to connect social activity to:
- Website visits
- Leads
- Qualified leads
- Conversions
- Revenue
The lesson is:
Measure what matters to your objective.
Marketing KPI Dashboard
A KPI dashboard gives marketers a centralized view of important performance indicators.
A simple dashboard might include:
| KPI | Current | Previous Period | Target |
|---|---|---|---|
| Website Traffic | 25,000 | 21,000 | 30,000 |
| Leads | 850 | 700 | 1,000 |
| Conversion Rate | 3.4% | 3.1% | 4% |
| Cost Per Lead | $18 | $21 | $15 |
| Customers | 120 | 95 | 150 |
| Revenue | $45,000 | $39,000 | $55,000 |
The exact KPIs should depend on the business.
How to Build a Marketing KPI Dashboard
Step 1: Define Business Goals
Start with the organization’s most important goals.
Examples:
- Increase revenue
- Generate leads
- Increase customer retention
- Launch a new product
- Improve brand awareness
Step 2: Select Marketing Objectives
Translate business goals into marketing objectives.
Step 3: Choose KPIs
Select a limited number of metrics that directly help measure those objectives.
Step 4: Set Targets
Create measurable targets where appropriate.
Step 5: Establish Reporting Frequency
Some KPIs should be monitored daily, while others may be more useful weekly or monthly.
Step 6: Analyze Trends
Do not look only at one day’s result.
Compare performance across meaningful periods.
Step 7: Take Action
The purpose of a KPI dashboard is not simply to display numbers.
Use the information to decide what should be tested, improved, reduced, or expanded.
Marketing KPIs by Marketing Channel
Different channels require different KPIs.
| Channel | Important KPIs |
|---|---|
| SEO | Organic traffic, rankings, impressions, CTR, conversions |
| Google Ads | CTR, CPC, conversions, CPA, ROAS |
| Social Media | Reach, impressions, engagement, clicks, conversions |
| Clicks, conversions, unsubscribe rate, list growth | |
| Content Marketing | Views, engagement, leads, assisted conversions |
| E-commerce | Conversion rate, AOV, revenue, ROAS |
| Lead Generation | Leads, qualified leads, CPL, lead-to-customer rate |
| Website | Traffic, engagement, conversion rate |
| Branding | Reach, impressions, branded searches |
| Retention | Retention rate, churn, repeat purchases |
Marketing KPIs for Small Businesses
Small businesses do not need to track dozens of KPIs.
A simple dashboard could focus on:
- Website visitors
- Leads
- Qualified leads
- Conversion rate
- Cost per lead
- Customers
- Customer acquisition cost
- Revenue
- Marketing ROI
- Customer retention
This provides a practical overview without creating unnecessary reporting complexity.
Marketing KPIs for E-Commerce Businesses
E-commerce businesses often need KPIs related to traffic, purchases, and customer value.
Important KPIs can include:
- Website traffic
- Product views
- Add-to-cart rate
- Checkout rate
- Conversion rate
- Average order value
- Revenue
- ROAS
- CAC
- Repeat purchase rate
- Customer lifetime value
- Cart abandonment
Marketing KPIs for B2B Businesses
B2B marketing often involves longer buying cycles.
Useful KPIs can include:
- Website traffic
- Content engagement
- Leads
- Marketing qualified leads
- Sales qualified leads
- Cost per lead
- Lead-to-opportunity rate
- Opportunity-to-customer rate
- Pipeline value
- Customer acquisition cost
- Revenue
B2B teams should also consider the time lag between marketing activity and closed revenue.
Marketing KPIs for Social Media
A social media dashboard might include:
- Reach
- Impressions
- Engagement rate
- Video views
- Watch time
- Link clicks
- Follower growth
- Website traffic
- Leads
- Conversions
The exact metrics should depend on the platform and business objective.
Marketing KPIs for SEO
An SEO dashboard might include:
- Organic traffic
- Search impressions
- Organic clicks
- Organic CTR
- Keyword rankings
- Indexed pages
- Backlinks
- Conversions
- Revenue from organic search
However, SEO success should not be judged solely by rankings.
A keyword ranking is useful only when it contributes to relevant visibility and meaningful outcomes.
Marketing KPI Reporting
Good reporting is not about creating the longest spreadsheet.
Effective reporting should answer questions such as:
What happened?
Why did it happen?
What changed?
What worked?
What did not work?
What should we test next?
For example:
Website traffic increased by 30%, but lead volume increased by only 5%.
That finding deserves investigation.
Possible questions include:
- Did traffic come from the right audience?
- Did landing page performance change?
- Did traffic come from informational searches?
- Did the offer change?
- Was conversion tracking working correctly?
How Often Should You Track Marketing KPIs?
There is no universal reporting frequency.
It depends on the KPI and business.
Daily
Useful for monitoring:
- Advertising spend
- Major campaign problems
- Website outages
- Significant sales activity
Weekly
Useful for:
- Campaign performance
- Leads
- Traffic trends
- Social media activity
- Paid advertising
Monthly
Useful for:
- Revenue
- CAC
- ROI
- SEO trends
- Customer acquisition
- Channel performance
Quarterly
Useful for:
- Strategic performance
- Marketing contribution
- Customer lifetime value
- Long-term growth
- Budget allocation
Common Marketing KPI Mistakes
Mistake 1: Tracking Too Many KPIs
More data does not automatically mean better decisions.
Choose KPIs that matter.
Mistake 2: Focusing Only on Traffic
Traffic is useful, but traffic without meaningful outcomes can be misleading.
Mistake 3: Ignoring Lead Quality
A large number of low-quality leads may create additional work without generating enough revenue.
Mistake 4: Comparing Different Channels Without Context
SEO, social media, email, and paid advertising have different roles.
They should be evaluated using appropriate KPIs and timeframes.
Mistake 5: Changing Strategy Too Quickly
Some marketing activities need time before their impact can be properly evaluated.
Avoid making major decisions based on insufficient data.
Mistake 6: Ignoring Tracking Problems
Incorrect analytics implementation can lead to incorrect conclusions.
Before analyzing performance, make sure your tracking system is configured properly.
Mistake 7: Confusing Correlation With Causation
Two metrics can move together without one necessarily causing the other.
For example, increased advertising and increased sales may occur at the same time, but other factors could also contribute to sales.
How to Improve Marketing Performance Using KPIs
KPIs become valuable when they lead to action.
Suppose your data shows:
High traffic + low conversion rate
You could investigate:
- Landing page
- Offer
- CTA
- Page speed
- Mobile experience
- Audience relevance
Suppose you see:
Low traffic + high conversion rate
You may have a strong offer but insufficient reach.
You could investigate:
- SEO
- Paid advertising
- Content distribution
- Social media
- Partnerships
Suppose you see:
High leads + low sales
You may need to investigate:
- Lead quality
- Sales follow-up
- Pricing
- Product-market fit
- Sales process
KPIs therefore help you identify where to investigate next.
A Simple Marketing KPI Framework
For beginners, this framework can make KPI tracking easier.
Step 1: Define Your Goal
What does the business want to achieve?
Step 2: Define Your Audience
Who are you trying to reach?
Step 3: Choose Marketing Channels
Where will you reach your audience?
Step 4: Choose KPIs
What numbers will show progress?
Step 5: Set Targets
What level of performance are you aiming for?
Step 6: Track Data
Collect accurate data consistently.
Step 7: Analyze
Look for trends and problems.
Step 8: Optimize
Make changes based on evidence.
Step 9: Test
Run experiments where appropriate.
Step 10: Repeat
Marketing measurement should be an ongoing process.
Example of a Complete Marketing KPI Strategy
Imagine a small digital marketing agency wants to generate more clients.
Its objective is:
Generate 50 qualified leads per month.
The agency could track:
Awareness
- Search impressions
- Website traffic
- Social reach
Acquisition
- Organic traffic
- Paid traffic
- Cost per click
- Cost per lead
Conversion
- Landing page conversion rate
- Leads
- Qualified leads
- Lead-to-customer rate
Sales
- Customers
- Customer acquisition cost
- Revenue
Profitability
- Marketing ROI
- Customer lifetime value
This creates a complete measurement framework.
Marketing KPIs and Data-Driven Marketing
Data-driven marketing means using data to inform marketing decisions.
Instead of relying entirely on assumptions, marketers can use performance data to identify patterns and test strategies.
For example:
If one landing page has a higher conversion rate than another, marketers can investigate why.
If one advertising campaign generates more qualified leads, the team can analyze its:
- Audience
- Keyword targeting
- Creative
- Offer
- Landing page
Data does not eliminate the need for human judgment. Instead, it gives marketers additional evidence for making decisions.
The Role of Analytics in Marketing KPIs
Analytics tools help businesses collect and understand marketing data.
A modern marketing measurement system may combine data from:
- Website analytics
- Search platforms
- Advertising platforms
- CRM systems
- Email platforms
- E-commerce platforms
- Social media platforms
Combining these sources can provide a broader view of the customer journey.
However, data integration and attribution can become complex, especially for businesses with multiple channels.
Attribution and Marketing KPIs
Attribution attempts to understand which marketing touchpoints contributed to a conversion.
A customer may interact with a business several times before purchasing.
For example:
Google Search → Blog Post → Social Media → Email → Website → Purchase
Which channel deserves credit?
There is no single attribution model that is perfect for every business.
Common approaches include:
- First-touch attribution
- Last-touch attribution
- Linear attribution
- Position-based attribution
- Data-driven approaches
Marketers should understand the limitations of their attribution model before using attributed revenue to make major decisions.
Leading vs Lagging KPIs
Another useful distinction is between leading indicators and lagging indicators.
Leading KPIs
Leading indicators can provide earlier signals of future performance.
Examples:
- Website engagement
- Leads
- Email subscribers
- Qualified opportunities
- Product trials
Lagging KPIs
Lagging indicators measure outcomes that have already occurred.
Examples:
- Revenue
- Customers acquired
- Profit
- Customer retention
A balanced dashboard can include both.
How AI Can Help With Marketing KPIs
Artificial intelligence is increasingly being used to support marketing analysis.
AI-powered systems can help marketers:
- Detect patterns
- Summarize reports
- Identify unusual changes
- Segment audiences
- Analyze customer behavior
- Generate performance summaries
- Assist with forecasting
However, AI-generated analysis should be reviewed carefully.
Good data quality remains important.
AI cannot fix inaccurate tracking simply by analyzing the data more quickly.
Future of Marketing KPIs
Marketing measurement is becoming increasingly complex.
Customers interact with businesses through many channels:
- Search engines
- Social media
- Websites
- Mobile applications
- Video
- Retail platforms
- Offline channels
This makes it harder to connect every interaction to a final purchase.
At the same time, privacy changes and platform restrictions can affect tracking capabilities.
As a result, marketers increasingly need to focus on:
- First-party data
- Consent
- Reliable measurement
- Business outcomes
- Customer value
- Experimentation
- Cross-channel analysis
The future of marketing KPIs is likely to involve a combination of automated analytics, human interpretation, experimentation, and privacy-conscious measurement.
50+ Marketing KPIs Quick Reference
Here is a useful summary of the major KPIs covered in this guide:
- Impressions
- Reach
- Brand Search Volume
- Share of Voice
- Website Traffic
- Organic Traffic
- Paid Traffic
- Referral Traffic
- Engagement
- Landing Page Conversion Rate
- Keyword Rankings
- Search Impressions
- Organic CTR
- Backlinks
- Content Views
- Content Engagement
- Content Conversion Rate
- Assisted Conversions
- Followers
- Social Engagement Rate
- Social Reach
- Social Impressions
- Social CTR
- Social Conversions
- CPC
- CTR
- CPM
- CPL
- CPA
- ROAS
- Leads
- Qualified Leads
- Lead Conversion Rate
- Lead-to-Customer Rate
- Email Open Rate
- Email CTR
- Email Conversion Rate
- Unsubscribe Rate
- Email List Growth
- Conversion Rate
- Number of Conversions
- Abandonment Rate
- CAC
- CLV
- Customer Retention Rate
- Churn Rate
- Marketing-Generated Revenue
- Marketing ROI
- Revenue Per Customer
- Pipeline Value
- Opportunity Conversion Rate
- Repeat Purchase Rate
- Average Order Value
- Add-to-Cart Rate
- Checkout Conversion Rate
Final Conclusion
Marketing KPIs are essential for understanding whether your marketing efforts are actually contributing to your goals.
They help marketers move beyond assumptions and look at measurable evidence.
However, effective KPI tracking is not about collecting the largest possible amount of data.
It is about selecting the right data for the right objective.
If your goal is brand awareness, you may focus on reach, impressions, and branded search activity.
If your goal is lead generation, you may focus on leads, qualified leads, conversion rate, and cost per lead.
If your goal is sales, you may focus on customers, revenue, customer acquisition cost, and return on investment.
If your goal is retention, you may focus on repeat purchases, retention rate, churn, and customer lifetime value.
The most effective marketing measurement systems connect:
Business Goals → Marketing Objectives → KPIs → Targets → Tracking → Analysis → Optimization
Start with a small number of meaningful KPIs. Make sure your tracking is reliable. Review trends rather than isolated numbers. Most importantly, use the information to make better marketing decisions.
A KPI is not valuable simply because it appears on a dashboard.
A KPI becomes valuable when it helps you understand performance and take meaningful action.
SEO Information
SEO Title: Marketing KPIs: 50+ Key Marketing Metrics Every Marketer Should Track
Meta Description: Learn the most important marketing KPIs, including ROI, ROAS, CAC, CLV, CTR, CPC, conversion rate, leads, SEO, social media, and email metrics.
Primary Keyword: Marketing KPIs
Related Keywords:
- marketing KPIs for beginners
- digital marketing KPIs
- marketing metrics
- key performance indicators in marketing
- marketing performance metrics
- digital marketing metrics
- marketing analytics
- KPI dashboard
- marketing ROI
- marketing performance measurement